Using the Model for Improvement methodology to close the poverty related attainment gap in numeracy
Through the use of data, headteachers from Earlston Cluster identified an attainment gap in numeracy for their schools. They agreed to combine their PEF allocation and take a shared approach to address this gap. The settings included Earlston High School, Channelkirk Primary School, Earlston Primary School, Gordon Primary School, Lauder Primary School, Melrose Primary School, Newtown Primary School, St. Boswells Primary School and Westruther Primary School.
How to use this exemplar
The resource contains:
- Details the journey of a cluster of settings who worked collaboratively to combine their Pupil Equity Funding allocations.
- provides ideas on how to use data to identify individual learners who require further support to progress in numeracy. It also provides information on how practitioners are working collaboratively to support learning and lead change.
- demonstrates an effective numeracy intervention that could be used in your setting using the Model for Improvement effectively to plan, monitor, implement and evaluate change.
- can be used to reflect upon your own interventions – what measures do you have in place to give you confidence that changes have led to an improvement?
- can encourage reflecting on your own collaborative approaches and their effectiveness.
Improvement questions
- What range of evidence do use to give you confidence that you can identify your learners' needs in numeracy?
- Once you have identified the need, how are you going to establish an aim (outcome) that is specific, has a timeframe, is aligned to your goals, and is measurable? Remember that without effective measures, you cannot be sure that change is leading to improvement.
- Are you collaborating effectively to ensure improvements for your learners? If not, what are the barriers and what can you do to overcome them?
Explore this exemplar
Video playlist
See 17 videos on YouTube playlist (see small menu at top right of video to access all the videos individually).
What was done?
A depute head teacher from one of the primary schools was given the role of ‘Strategic Lead’ with oversight of the project. In 2018/2019 the cluster funded the depute head teacher to be out of their setting for one day per week to perform the strategic function.
A class teacher (0.66) was appointed as ‘Programme Coordinator’ to manage the delivery of the project, including staff training, quality assurance and data analysis. In 2018/2019 this role was changed to principal teacher.
Additional Needs Assistants (ANAs) were also appointed to deliver one to one numeracy interventions. Currently there are 220 hours being shared by 11 ANAs across the cluster settings – hours within each setting are calculated proportionately based on PEF eligibility data.
A successful numeracy intervention that had been developed in one of the primary settings was scaled up using the Model for Improvement and implemented across Earlston Cluster.
A range of measures, outcomes, process and balance measures were planned for and carried out during the project. Impact data was shared and reported for individual settings and the cluster overall to allow for improvement planning and further strategic work.
Settings across the cluster combined their PEF allocation to create a Cluster Pupil Equity Fund. Learners were identified by selecting those who were not making the expected progress in numeracy and who qualified for PEF funding by claiming free school meals (FSM).
Additional criteria were also used to identify learners:
- If the child was claiming the clothing grant (CG)
- If the child had low Scottish Index of Multiple Deprivation (SMID) banding
- If the child was care experienced (CE) or
- If the child was recognised as being 'hidden poverty'(HP). For example, learners of families known to be adversely affected by poverty but are not identifiable using FSM, CG, SIMD or CE as indicators.
The Programme Coordinator planned and facilitated training for all ANAs and Support for Learning practitioners (SfL). This included providing opportunities to network, work collaboratively and participate in Learning Rounds across the cluster. ANAs were trained to deliver the interventions, which were specific to individual needs and based on assessment evidence. This was monitored and moderated across the cluster.
The intervention consisted of individual targets, set by practitioners, which were the focus for 4-6 weeks.
- Learners participate daily in 1:1, interactive and targeted sessions. Three sessions per week that last for 15 minutes, and another extended 30-minute session also takes place.
- Learners complete an independent baseline assessment at the start of the target, returning to it weekly during the extended session and for the duration of the target.
- Learners track their progress through run charts which demonstrate their accuracy, speed and the level of support they require. The run charts demonstrate their progress against three metrics which, when used in combination, can be used to demonstrate progress over time.
The metrics:
- Accuracy i.e. the number of correct attempts
- Time taken
- Level of support
For progress to be made, the run charts were monitored to ensure that accuracy increases whilst time taken and level of support decrease.
They also reflect on their learning over the week and discuss next steps with the ANA. Three months after the learner completes their target, they independently re-visit the initial baseline assessment to ensure learning is retained.
It is important that the interventions take place on a 1:1 ratio, in a quiet area and using resources appropriate to the learner and their target.
In primary settings targets are created by the class practitioner and/or SfL practitioner and shared with the ANA. In the secondary setting, a practitioner from the maths department works closely with the SfL practitioner to create targets.
Parents/Carers were informed about the interventions and invited into all settings to learn about and participate in the sessions.
Why was it done?
The Earlston Cluster has worked in close partnership for a number of years with success and has an embedded culture of collaborative practice. The head teachers felt that working collaboratively in response to the Pupil Equity Fund would both benefit and galvanise the cluster's effectiveness in leading change.
Analysis of primary and secondary attainment data had provided evidence of a need to increase attainment in numeracy across the cluster. Attainment data at primary was gathered through the analysis of a cluster designed tracking and monitoring database. Importantly, all schools in the cluster use the same system based around the input of moderated teacher judgments about learner progress against the National Benchmarks. In the high school, cluster data was combined with INSIGHT data, looking at numeracy attainment in Earlston High School against that of a virtual comparator school.
What was the impact?
Cluster data after Year 1
Standardised Data:
- 63% of learners demonstrated an increase of at least 1 stanine in their standardised testing scores in maths and numeracy
- 76% of learners have demonstrated an increase in their Standardised Age Score (SAS)
- 79% of learners demonstrated an increase in their Number, Money and Measure scores
| Below average | Average | Above average | |
| Nov-17 | 76% | 24% | 0% |
| May-18 | 50% | 44% | 6% |
| Sep-18 | 53% | 42% | 5% |
| May-19 | 31% | 58% |
8% |
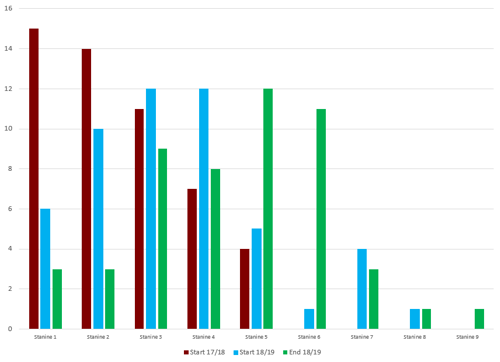
Stanine spreads for the same learners over time:
Stanine week 1 – Very low
Stanine weeks 2-3 – Below average
Stanine weeks 4-6 – Average
Stanine weeks 7-9 – Above average
Learner Survey
- 95% of learners enjoyed working with an adult away from class.
- 98% of learners said that the extra help they are getting is helping them with their learning.
- 97% of learners said that the extra help they are getting is making things easier for them in class.
- 94% of learners said that the extra help makes them more confident.
Download(s)
Share this resource: