Ask and answer questions from a bar graph
Published 11/11/2020.
Last updated 11/04/2023
Explore this resource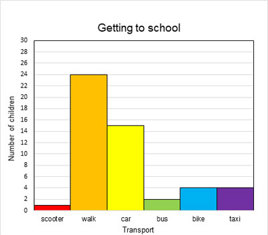
- Using the bar graph on this page, remind children of the key features of this type of graph, including the:
- title
- labels
- scale (notice that each interval represents two children).
- Share with children that the bar graph shows data about how children in P3 travel to school.
- Ask children to answer the following questions based on the data in the bar graph.
- What way do most children get to school?
- How many children travel this way?
- What way do fewest children get to school?
- How many children travel that way?
- Which forms of transport were used by less than ten children?
- How many P3 children are there altogether?
- Ask children to create four more questions based on the data in this bar graph. Encourage children to try their questions out with one another and to explain the answers.
- Extension activity: Ask children to create a bar graph. They may choose the context and depending on their circumstances, be able to gather the data themselves. If this is not possible, they can create the data. Ask them to create questions based on their data. Working with someone else, they can ask and answer each other’s questions.
National benchmarks
When identifying fact from opinion at first level, the following benchmarks may be considered:
- Asks and answers questions to extract key information from a variety of data sets including charts, diagrams, bar graphs and tables.
- Selects and uses the most appropriate way to gather and sort data for a given purpose, for example, a survey, questionnaire or group tallies.
- Uses a variety of different methods, including the use of digital technologies, to display data, for example, as block graphs, bar graphs, tables, Carroll diagrams and Venn diagrams.
Improvement questions
- Think about the range of learners in your class and their individual circumstances. In what ways could you adapt this learning activity to meet the needs of your learners?
- Following the learning activity, consider how well your students understood bar graphs, including how successfully they were able to:
- answer the questions about the bar graph
- create their own questions about the data presented in the bar graph explain their answers to others.
Share this resource: